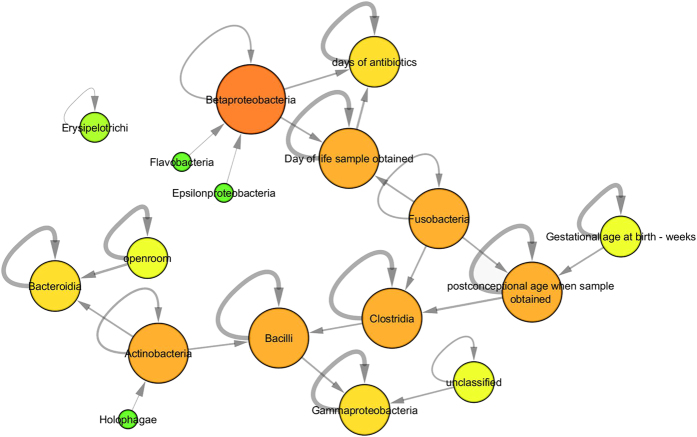
Figure 1. Dynamic Bayesian Network of Infant Gut Microbiota Dynamics.
The DBN network included the clinical variables and bacteria taxa pictured above. Nodes indicate variables, with greater size and redder color indicating greater node degree. Direction of edges indicate temporal statistical influence: the source node’s prior value predicts the target node’s present value. Edge thickness indicates strength of statistical dependence.

