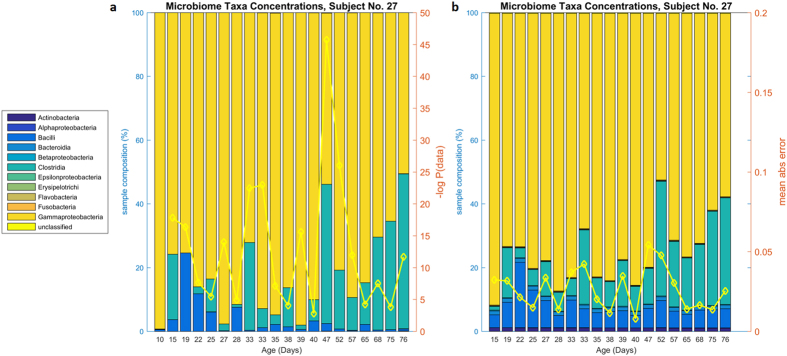
Figure 3. Actual and predicted microbiome composition for Subject No 27.
Subject No 27, panel (a) microbiota taxa abundances by sample. Panel (b) predicted microbiota taxa abundances by DBN. This subject shows a somewhat typical distribution of microbiota, dominated by Gammaproteobacteria that gives way to Clostridia. Small amounts of Bacilli are present, along with trace amounts of Actinobacteria. On the second axis, panel (a) shows the posterior likelihood of the data conditioned on the previous sample (yellow line); shown in negative log scale. Panel (b) shows predictions of bacteria taxa abundances given the previous sample’s abundances, according to the DBN. The prediction for a sample is based on the data from the previous sample. The second axis shows the mean absolute error per sample (yellow line).

