
Figure 5. Iterative Prediction of subject number 27.
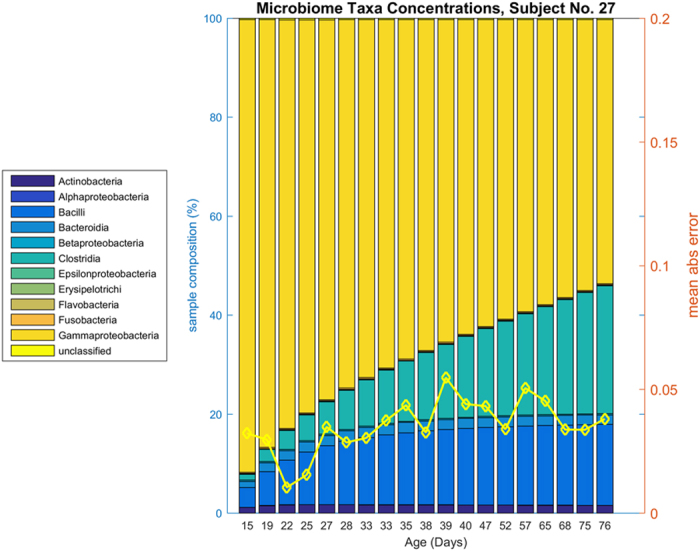
Compare Fig. 3, Panel (a). This presents an idealized prediction of the trajectory of subject number 27 from day 15 iteratively simulated into the future. The second axis shows the mean absolute error per sample (yellow line).