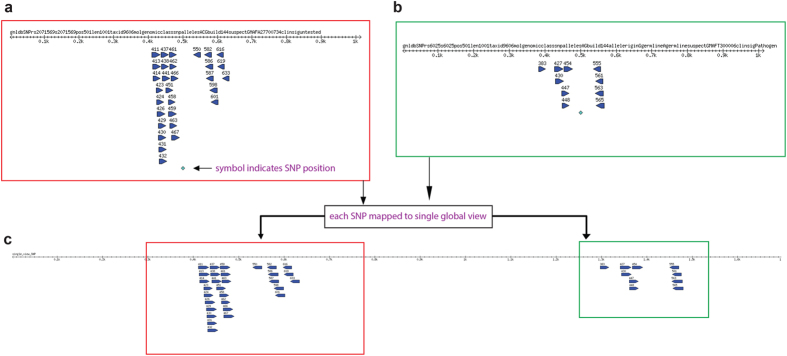
Figure 4. PrimerMapper graphical outputs for SNP based sequences.
(a,b) A sample SNP sequence graphical output generated by PrimerMapper is shown. Primers spanning the SNP (which is denoted by a green symbol) are mapped onto their derived sequence. Each primer is named by its starting position and the fastA header from each sequence is at the top of the scaled graphic. The number line represents a scaled version of the input sequence in base pairs. (c) A single assembled view of all inputted SNP sequences and their primers is also generated from SNP data by PrimerMapper.

