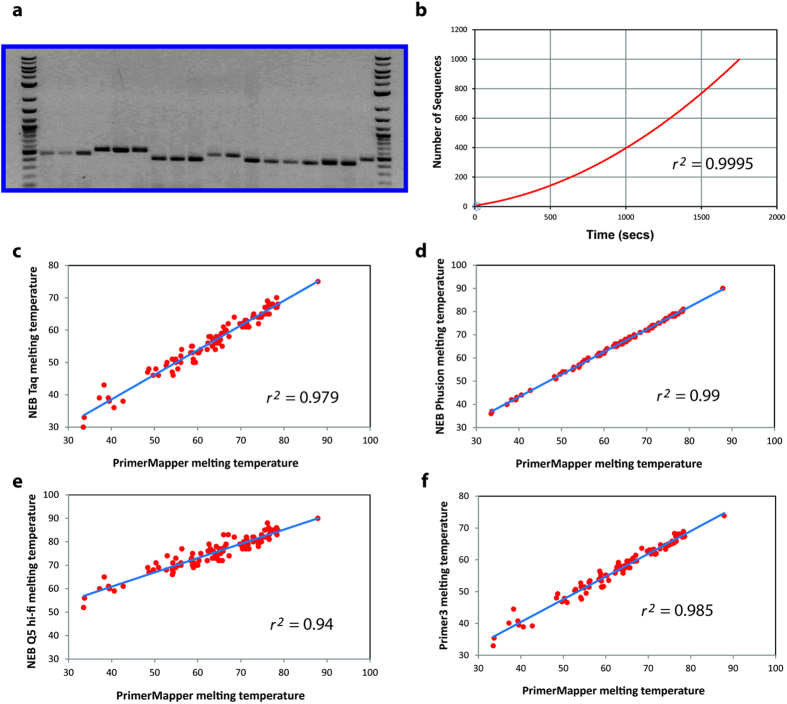
Figure 7. Validation and testing of PrimerMapper.
(a) Primers were designed using PrimerMapper to span the C. elegans transcript, ZK5204a, and PCR products from a series of PCR reactions using these primers were examined by gel electrophoresis. Primer sequences are displayed in Table 1. Robust bands of the correct size were obtained from each PCR. The first and last lanes are a GenRuler DNA ladder mix (Thermo Fisher Scientific, Waltham, MA). Primer parings starting from the left second lane were: F2 + R1, F2 + R2, F2 + R3, F2 + R4, F2 + R5, F2 + R6, F3 + R1, F3 + R2, F3 + R3, F3 + R4, F1 + R2, F1 + R3, F1 + R4, F1 + R5, F1 + R6, F1 + R8, F3 + R9, F5 + R6. (b) Files containing different numbers of sequences (2, 10, 20, 50, 100, 150, 200, 1,000) were provided as input to PrimerMapper and ran using default settings to generate primer text files for each sequence and graphic file generation input text files (i.e. Step 1 of execution – see Fig. 2). The resulting data is plotted with time (seconds) on the x-axis and the number of sequences on the y-axis. Fitting the relationship between sequence number and run-time with a quadratic equation yields an R2 value of 0.9995. (c–f) Comparison of the melting temperatures obtained for PrimerMapper from 100 randomly generated primers (18–30bps in size) with that of the NEB calculator for NEB Taq DNA Polymerase (c), NEB Phusion® Polymerase (d), NEB Q5® Hi-Fi Polymerase (e), and with Primer316 (f).

