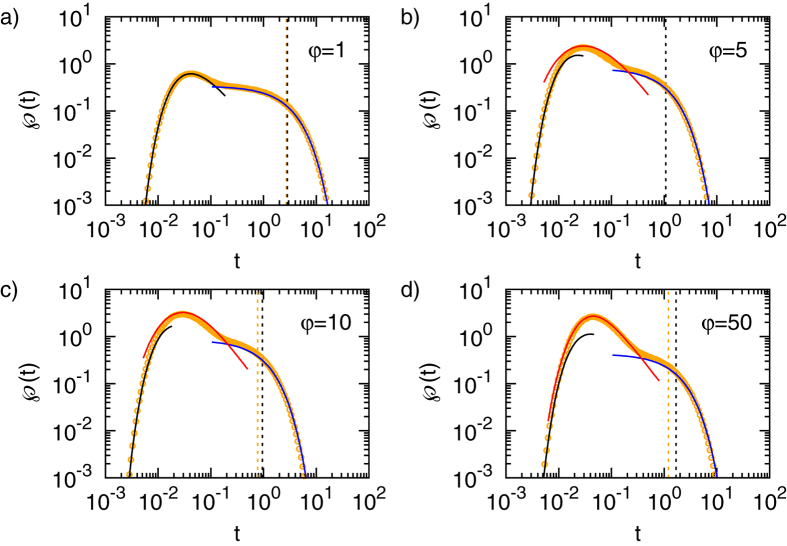
Figure 3. FPT densities for various degrees φ of heterogeneity and parameters xa = 0.1, xi = 0.4 and x0 = 0.6.
In this Figure the particle starts in the outer region of the system. The symbols denote the results from numerical inversion of Eq. (3a). The black lines correspond to the short time limit (5a) and the blue line denotes the long time asymptotics (7). The red line represents the intermediate time asymptotics (11b).

