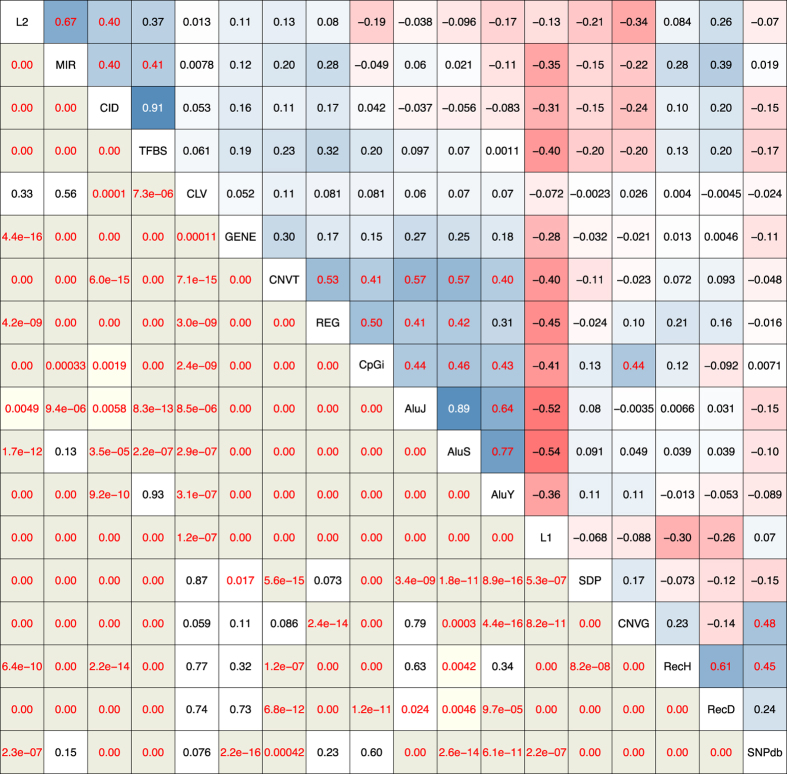
Figure 5. Parameters of prominent co-localizations.
Pearson correlation coefficient r-values based on 500-kb windows in twenty-two autosomes are shown in the upper triangle in the thermal scales employed in Fig. 1a, with blue for positive and red for negative correlations, and r-values greater than 0.4 are shown in red font (except for the two highest r-values in white font). Asymptotic P-values are shown in the lower-left triangle. The feature named inside a box on the diagonal at the junction between a column and a row participates in all the pairwise co-localizations represented on the intersecting column and row. P ≥ 0.05 are shown in black font in white boxes, 0.05 > P ≥ 0.01 in red font in white boxes, 0.01 > P ≥ 0.001 in red font in light yellow boxes, P < 0.001 in red font in grey boxes; and P < 10−16 are shown as ‘0.00’. Estimation of r and P values is described under Methods, and similar co-localization parameters obtained using 50, 200 and 2,000-kb windows are shown in Supplementary Fig. S3.

