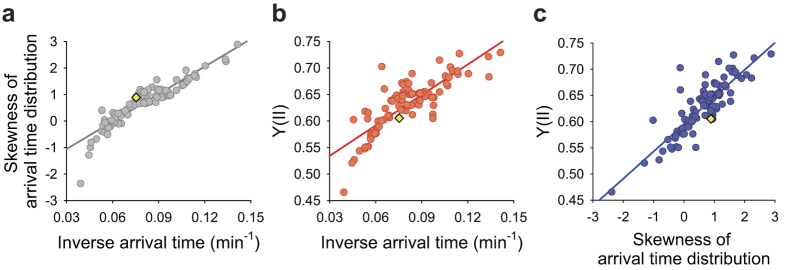
Figure 2. Correlation between phototaxis and photosynthetic efficiency in diverse strains.
(a) Scatter plot showing the correlation between skewness of arrival time distribution and inverse average arrival time of 100 strains, including the wild-type strain (CC-125) and 99 randomly selected insertional mutants with wide range of PSII operating efficiency (Y(II)) (R2 = 0.84). (b) Scatter plot showing the correlation between Y(II) and inverse average arrival time of the 100 strains (R2 = 0.69). (c) Scatter plot showing correlation between Y(II) and skewness of arrival time distribution of the 100 strains (R2 = 0.72). Cells were grown photomixotrophically under continuous low light condition (50 μmol photons m-2 s-1). Phototactic response was measured on 6,600 cells per analysis. The yellow diamond: the wild type (a–c). Data are the mean of three biological replicates.

