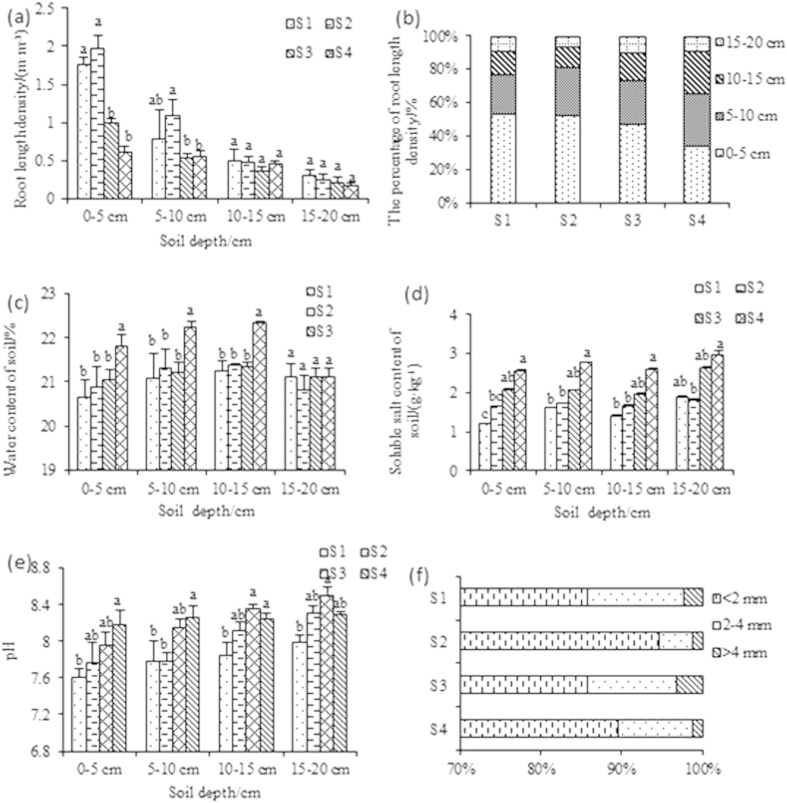
Figure 1.
Jerusalem artichoke (cv. NY-1) root length density distribution (a), percentage of root length density down the soil profile (b), and the changes in water content (c), soluble salt content (d), and pH (e) at different soil depths. Also shown is the percentage of total root length in different diameter class (f) of Jerusalem artichoke. Data are means + SE (n = 3). For graphs a-f, one-way ANOVA (main factor = salinity) followed by Duncan test (p = 0.05) was done for each soil layer separately.

