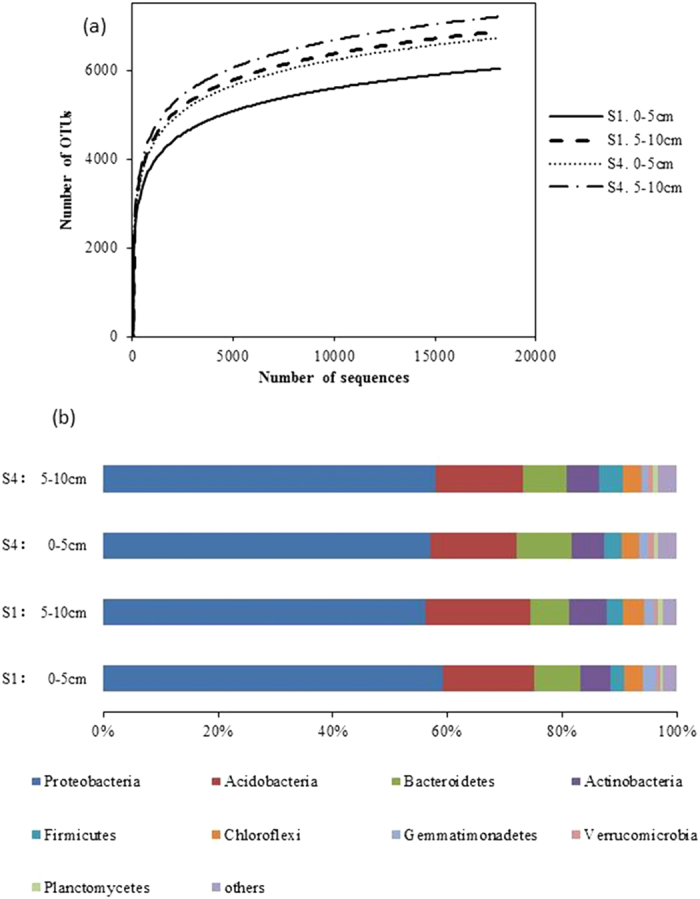
Figure 3.

(a) Rarefaction curves showing the observed OTU richness (at 97% identity) of the 16S rRNA gene with increasing sequencing depth. Mean values (n = 3) were shown for the two salinity treatments (S1 and S4) and two soil depths. (b) Comparison of the bacterial communities at the phylum level. Relative read abundance of different bacterial phyla in bacterial communities. Sequences that could not be classified into any known group were labeled “others”.
