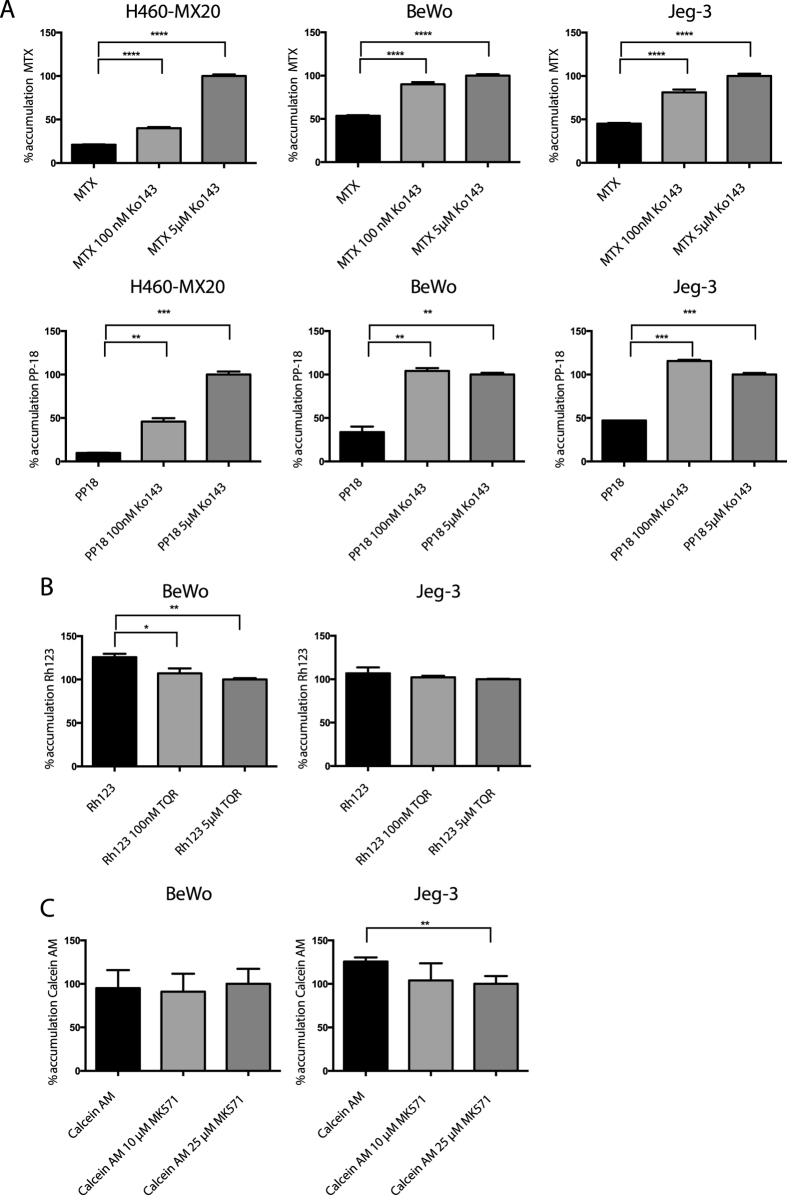
Figure 2. Accumulation of fluorescent substrates of ABCG2, P-gp, and MRP1, measured by flow cytometry.
(A) Choriocarcinoma cells and positive control ABCG2-expressing cell line H460-MX20 were incubated with ABCG2 substrates mitoxantrone (10 μM) or purpurin 18 (15 μM) with and without Ko143 (100 nM, 5 μM). (B) Choriocarcinoma cell lines incubated with P-gp substrate Rhodamine 123 (2 μM) with and without P-gp inhibitor tariquidar (100 nM, 5 μM). (C) Choriocarcinoma cell lines incubated with MRP1 substrate Calcein-AM (1 μM) with and without MRP1 inhibitor MK571 (10 μM, 25 μM). All accumulation values are normalized to accumulation of the maximally inhibited condition. Data represent means ± SD of three experiments (**p < 0.01, ***p < 0.001, ****p < 0.0001 by Student’s t test).

