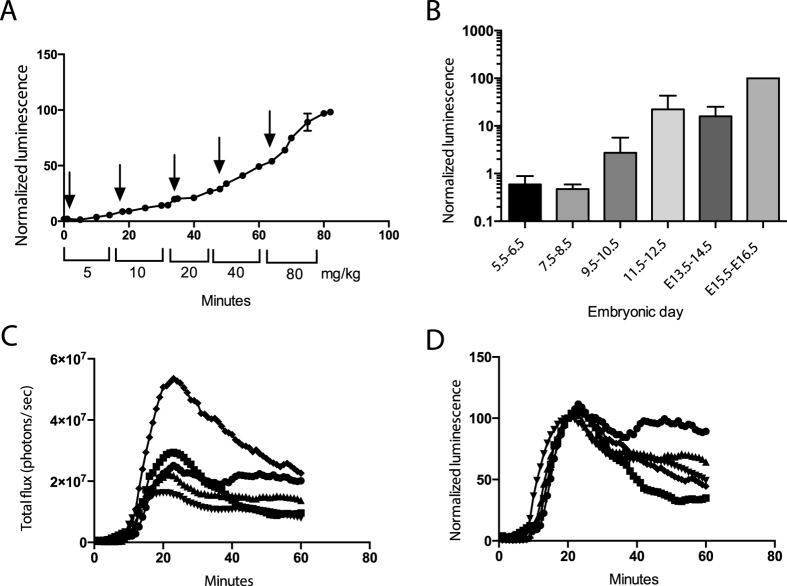
Figure 5. Validation of in vivo mouse model.
(A) Dose escalation study of pregnant mice, carrying fLuc-expressing fetuses and placentae, receiving increasing dosages of D-luciferin (arrow) over 80 minutes. Data normalized to the maximum signal of each mouse and represent mean ± SD of at least three different animals. (B) Maximum bioluminescence signals measured every two days between embryonic day 5.5 and 16.5. Data are normalized to the maximum BLI signal measured at the last time point, and are represented as mean ± SD of at least three different animals. (C) Bioluminescence signal intensities represented in photons per sec. (D) Data presented in (C) normalized to the 20-minute time point. Data represent mean ± SEM of five different animals. Number of mice, (A) n = 3, (B–D) n = 4, except for E5.5–6.5 (n = 2).

