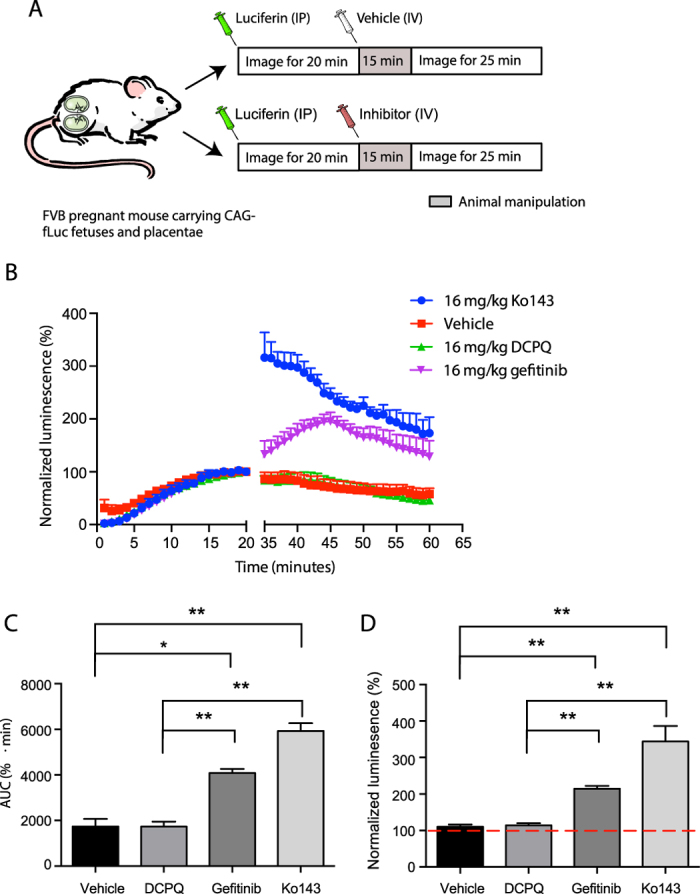
Figure 6. ABCG2 inhibition increases D-luciferin-mediated bioluminescence signal in vivo.

(A) Injection strategy utilized to study the effect of inhibitors. A baseline signal is gathered for the first 20 minutes, when the signal plateaus. At this point mice are removed from the imager and injected with vehicle, or inhibitors, after which they are returned for an additional 25 minutes of imaging. (B) Time activity curves of total flux (photons per sec) of pregnant mice, carrying fetuses and placentae expressing fLuc, injected with 5 mg/kg D-luciferin i.p., plus vehicle (negative control), Ko143, Gefitinib, or DCPQ (negative control). All inhibitors were injected at a dosage of 16 mg/kg. Data normalized to the 20-minute time point of each animal (baseline signal). (C) AUC acquired from the time activity curves for vehicle control and all three inhibitors. (D) Maximum BLI signals acquired from the post-injection phase from all four treatment injection conditions. Data represent mean ± SEM of at least four different animals (*p < 0.05, **p < 0.001 by Student’s t test). Number of mice, (B–D) Vehicle n = 5, Ko143 n = 5, DCPQ n = 6, gefitinib n = 4.
