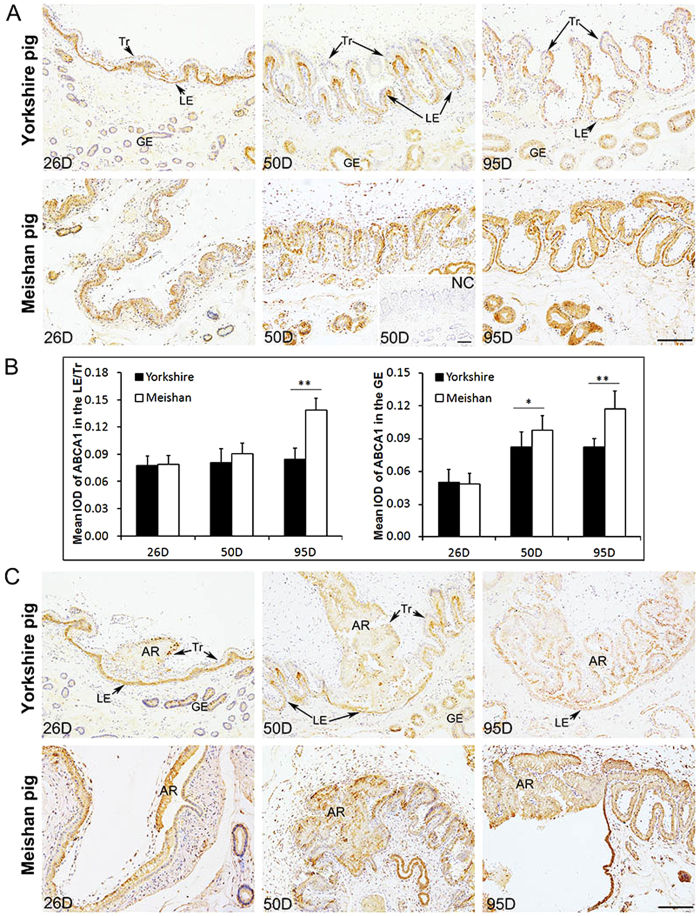
Figure 5. Immunohistochemical analysis of ABCA1 at the maternal-fetal interface and the placental areolae in Yorkshire and Meishan pigs.
Uterine/placental sections were obtained on Days 26, 50 and 95 of pregnancy. Tissue sections were stained with rabbit anti-human ABCA1 polyclonal antibody.The sections stained with isotype matched normal rabbit IgG served as negative control. (A) Images were taken from the maternal-fetal interface in Yorkshire and Meishan pigs. ABCA1 positive cells were observed in the epithelial bilayer and GE in Yorkshire and Meishan pigs on Days 26, 50 and 95 of pregnancy. Legend: Tr, trophoblast; LE, endometrial luminal epithelium; GE, glandular epithelium; D, day of pregnancy; NC, negative control; Scale bar = 100 μm. (B) Quantitative analysis of ABCA1 by measuring the average integrated optical density (IOD) in the epithelial bilayer (composed by Tr and LE) and GE during pregnancy. Asterisks indicate significant differences (mean ± SD) between breeds (*P < 0.05; **P < 0.01. Analyzed by PROC MIXED of SAS). (C) Images were taken from the placental areolae in Yorkshire and Meishan pigs. The ABCA1 positive signals were filled in all the areolar regions, including Tr, LE and GE on Days 26, 50 and 95 of pregnancy. AR, areola; Scale bar = 100 μm.

