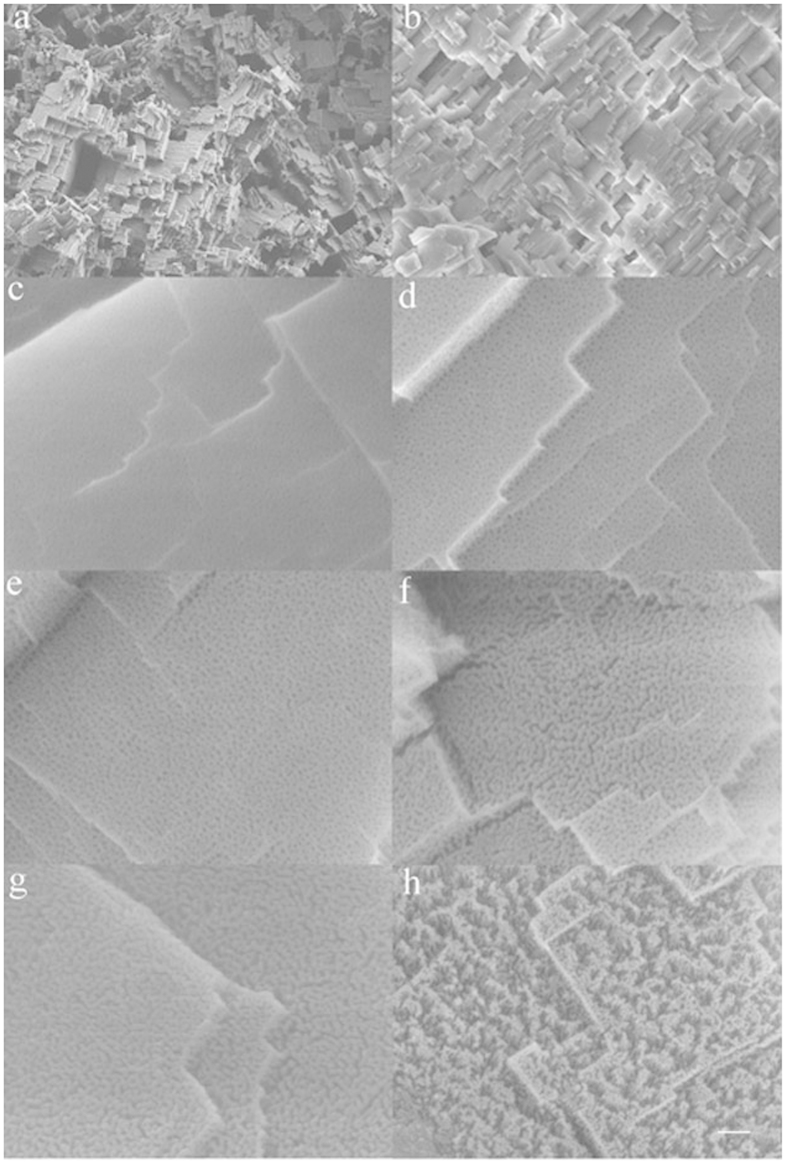
Figure 2. Topographical evolution of the aluminum surface.
The low resolution SEM images in a and b show the morphology after acid etching and after anodization for 20 min, respectively. The high resolution SEM images in (c–h) show the detail evolution of the surface at anodization time of 10 min, 15 min, 20 min, 25 min, 30 min, 35 min, respectively. The scale bar represents 8 μm for a, 2 μm for b, 100 nm for c–g, and 200 nm for h.

