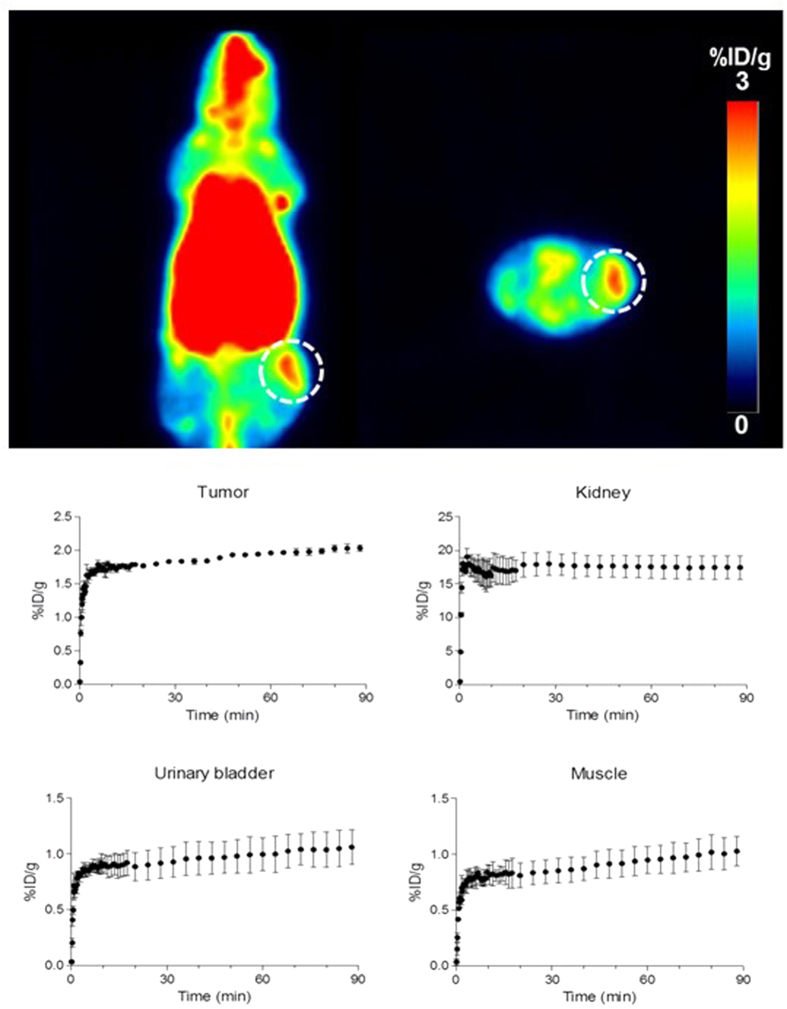
Figure 6. Representative coronal and axial PET images summed between 40 to 60 min of [18F]CB251 in a U87-MG tumour-bearing nude mouse (upper) and in vivo biodistribution of [18F]CB251 in tumour, kidney, bladder and muscle using PET image ROI-derived radiouptake percentage of injected dose per gram (bottom).
The results represent the mean ± SD (n = 3). The tumour is denoted by the dotted circle.

