Figure 8.
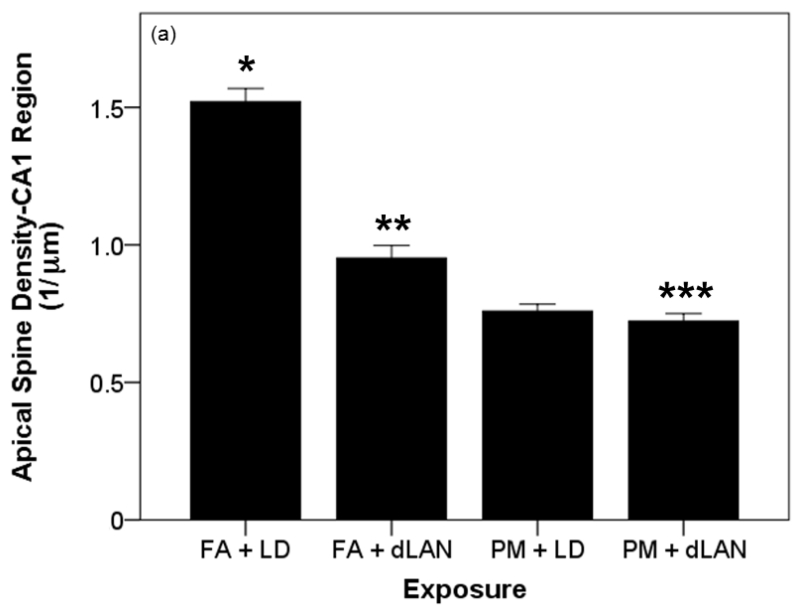
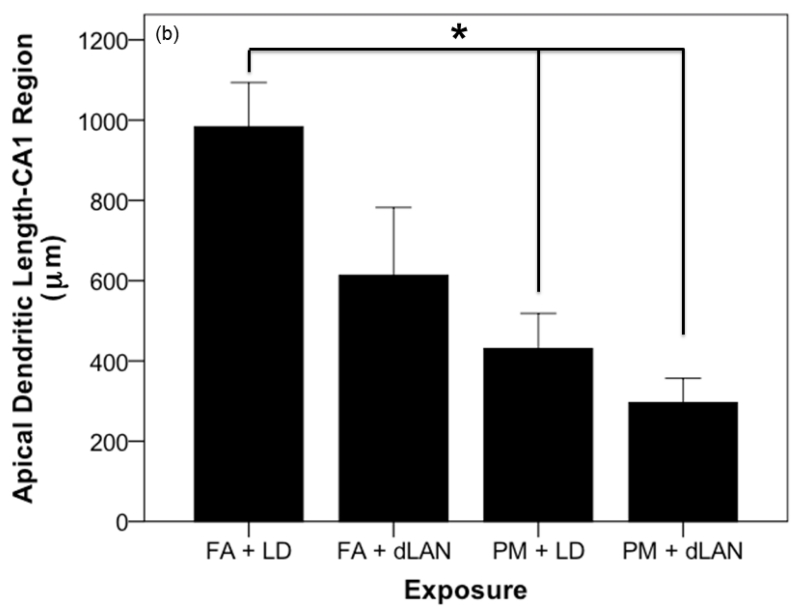
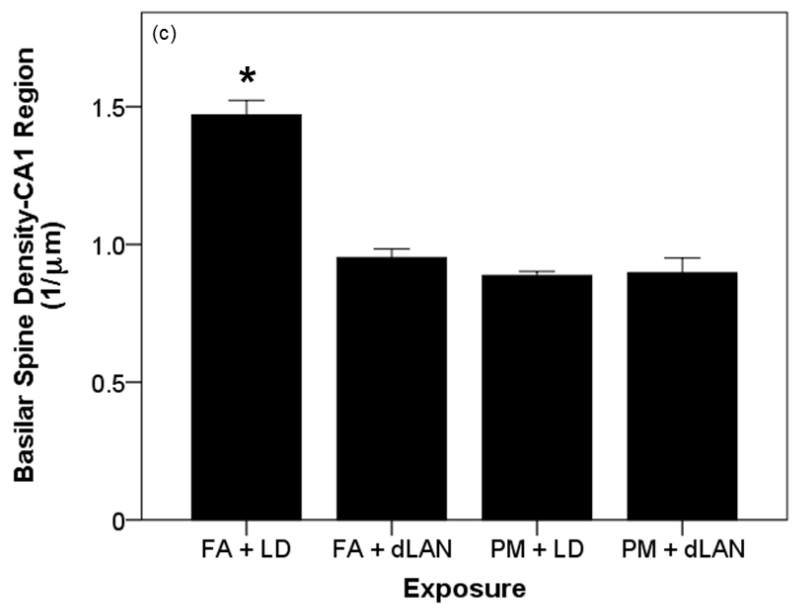
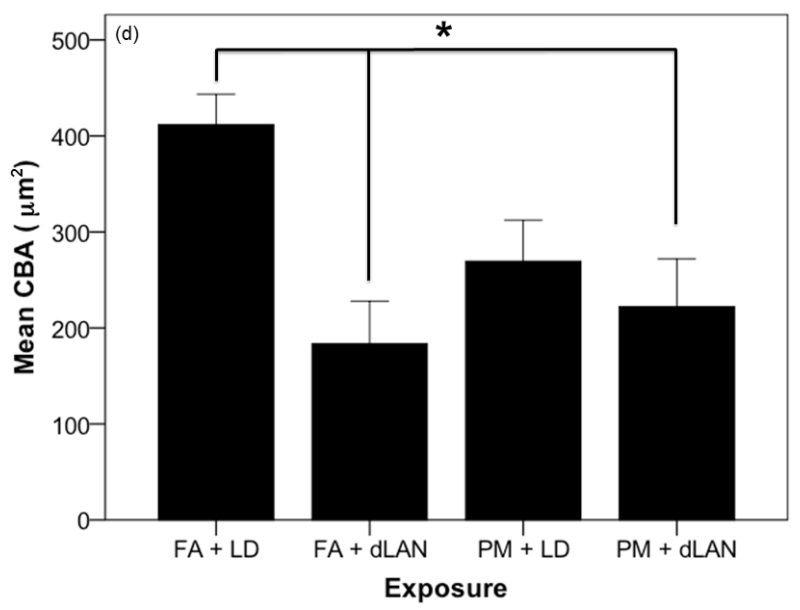
Effects of PM2.5 and/or dLAN exposure on hippocampal morphology of the CA1 region (mean + SEM). (a). Spine density of apical tips of pyramidal dendrites revealed differences between all exposed groups (p = 0.0001). FA + LD exposed mice had greater densities than the FA + dLAN (p = 0.0001), PM + LD (p = 0.0001), and PM + dLAN (p = 0.0001) exposed animals. (b). Significant differences were revealed between groups with regards to total apical dendritic length (p < 0.01). Control mice, FA + LD, had longer apical dendrites than PM + LD (p = 0.01) and PM + dLAN (p < 0.01) exposed groups. (c). All groups had significant differences with regards to basilar spinal densities (p < 0.001). Control, FA + LD, exposed mice had greater densities than FA + dLAN (p < 0.001), PM + LD (p = 0.0001), and PM + dLAN (p = 0.0001) exposed animals respectively. (d).Significant differences were revealed between groups regarding cell body area (p < 0.01). Control, FA + LD, exposed mice had a greater cell body area compared to FA + dLAN (p < 0.01) and PM + dLAN (p < 0.05) exposed animals.


