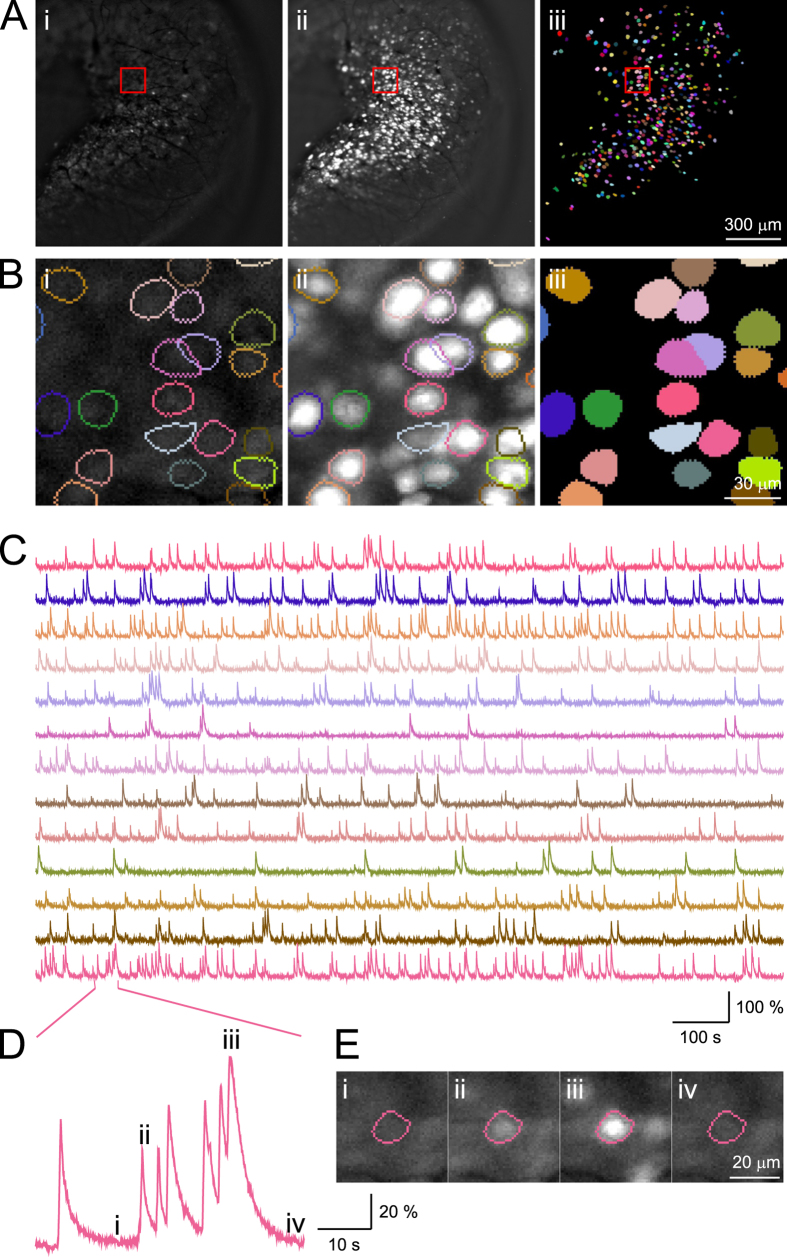
Figure 2. Imaging and identification of individual CA1 neurons.
(Ai) A representative image frame from a standard imaging session (imaging field is 1343 × 1343 µm2). (Aii) Projection of maximum fluorescence intensity value across all frames. (Aiii) Color plot of all 422 semi-automatically identified neurons superimposed onto the imaging field of view. (B) Zoom in illustration from the area highlighted in the red box from (A) (the field is 131.2 × 131.2 µm2). (C) Fluorescence traces extracted for neurons shown in (B), with the color for each trace matching those presented in (B). Single dimensional fluorescence amplitude was independently scaled for each neuron. (D,E) An example neuron that exhibits highly dynamic features. (Di,iv) indicate periods with little activity, and (Dii,iii) indicate periods with higher levels of activity.

