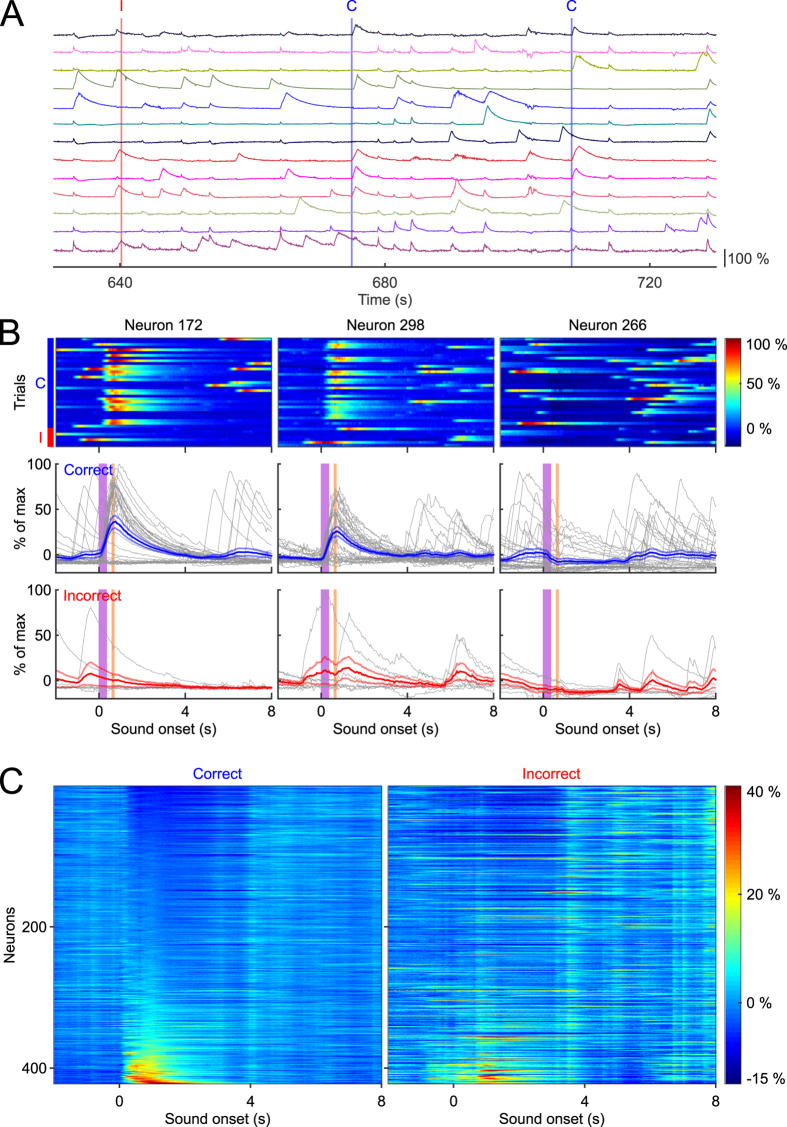
Figure 3. Tone evoked responses sorted by response magnitude.
(A) Individual traces from 13 representative neurons from a continuous 3 trial window of time. The red vertical demarcation indicates an incorrect trial (labelled with “I” at the top), and the blue lines indicate correct trials (labelled with “C” at the top). (B) Responses of three individual neurons plotted for all 40 trials. Top: plots of Ca2+ response magnitude sorted by correct trials (33 trials on the top, indicated by the blue bar to the left) and incorrect trials (7 trials at the bottom, indicated by the red bar to the left). Bottom: individual responses sorted by trial outcome, with each trial response plotted in gray, and averaged response ± SEM plotted in blue or red depending on trial outcome. (C) Mean response amplitude of all neurons sorted by least responsive (top) to most responsive (bottom), during 0–2 seconds of tone onset, separated by trial outcome.

