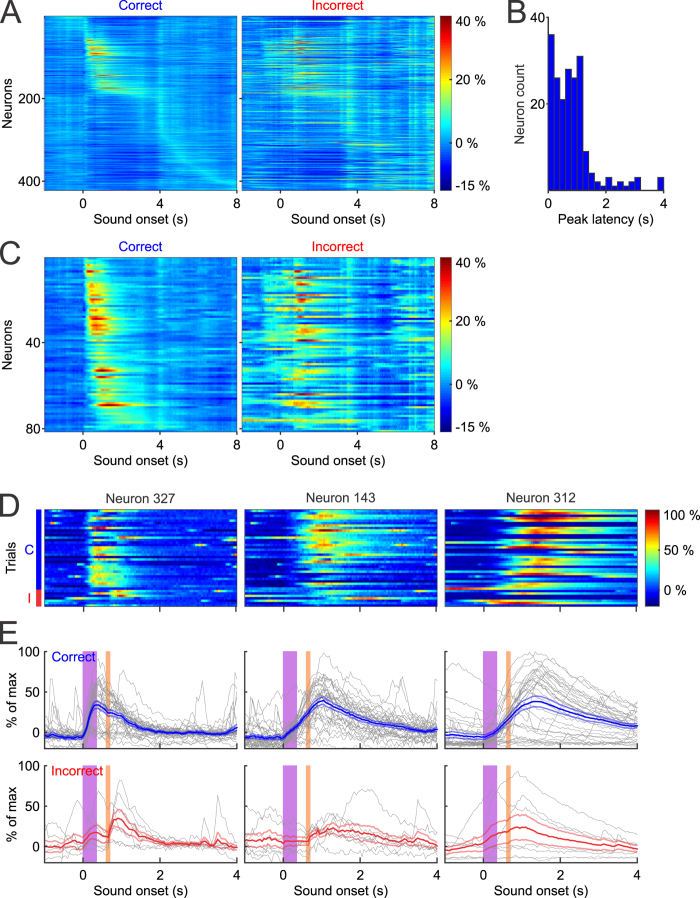
Figure 4. Tone evoked responses sorted by latency to peak amplitude.
(A) Neurons sorted based on latency following tone presentation over an 8 second window. (B) Histogram distribution of the latency for neurons that reached peak activity within 4 seconds of tone onset. (C) Statistically positively modulated neurons (n = 81) sorted by peak latency by trial outcome. (D, E) Three representative neurons that exhibit variability in response kinetics, defined as the rate of fluorescence increase after tone onset. Individual trial responses were plotted in gray, and mean responses ± SEM were plotted in blue or red, depending on trial outcome.

