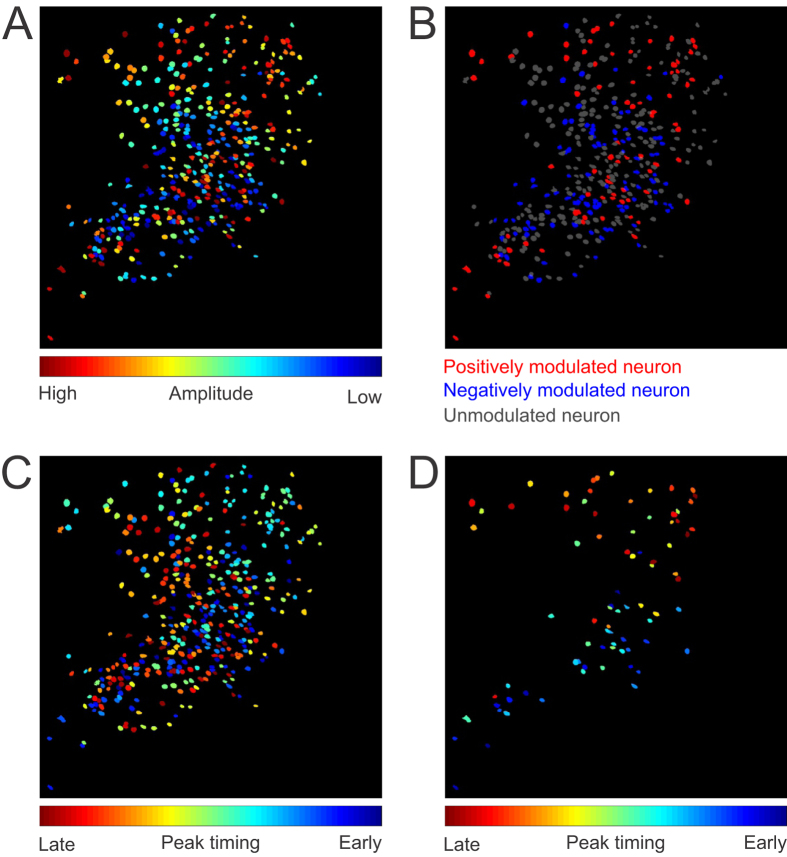
Figure 5. Spatial organization of task related CA1 neurons.
(A) Spatial distribution of all 422 neurons sorted by averaged amplitude during the cue-response window (0–2 seconds after tone onset). Neurons in dark red demonstrate the highest peak amplitude, whereas neurons in dark blue represent biggest negative amplitudes during this window. (B) Neurons are colored according to their task relevance, with red being significantly positively modulated (n = 81 neurons), blue being significantly negatively modulated (n = 102 neurons), and gray being not modulated (n = 239 neurons). Note, some anatomical clustering of the same color labelled neurons within close proximity to one another. (C) Spatial distribution of all 422 neurons sorted by the latency to peak amplitude. Neurons in blue reached peak amplitude quickly, whereas neurons in red reached peak amplitude more slowly. (D) Spatial distribution of the 81 positively modulated neurons, sorted by the latency to peak amplitude.

