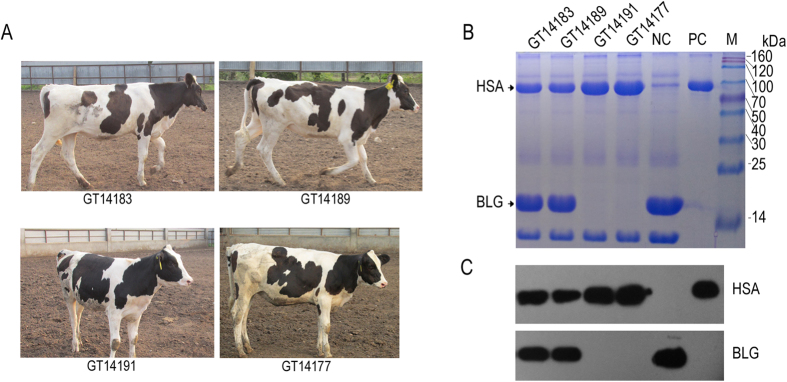
Figure 6. rHSA analysis and BLG expression in the targeted cows’ milk.
(A) The four targeted cows used in hormone-induced lactation. The photographs of the four cows were taken by the first author Yan Luo. (B) Analysis of HSA expression in milk using SDS-PAGE. (C) Analysis of HSA and BLG expression levels in milk using Western blot. NC, milk from non-transgenic cow used as negative control; PC, pdHSA (Sigma) used as positive control; GT14183 and GT14189 are heterozygous targeted calves; GT14191 and GT14177 are homozygous targeted calves.

