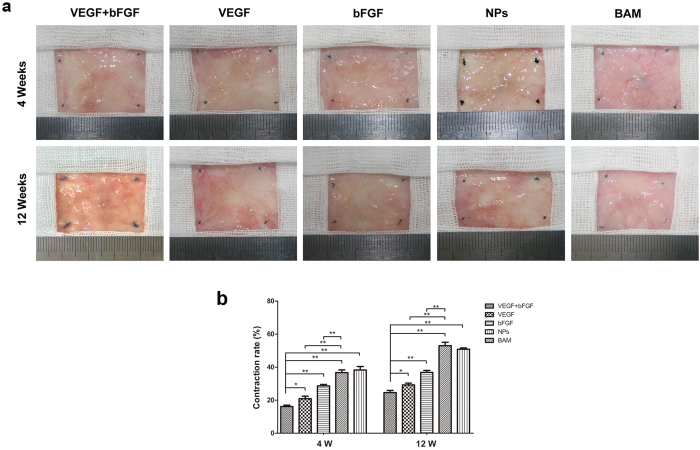
Figure 3. Gross morphological evaluation and contracture rate of regenerated bladder tissues in the five groups.
(a) Micrographs of the luminal surface of de novo bladder tissues removed from the original substitution sites in the five groups at 4 and 12 weeks post-surgery. (b) Evaluation of the graft contracture rate. The data are expressed as the mean ± SD, and the error bars represent the SD. *p < 0.05, **p < 0.01.

