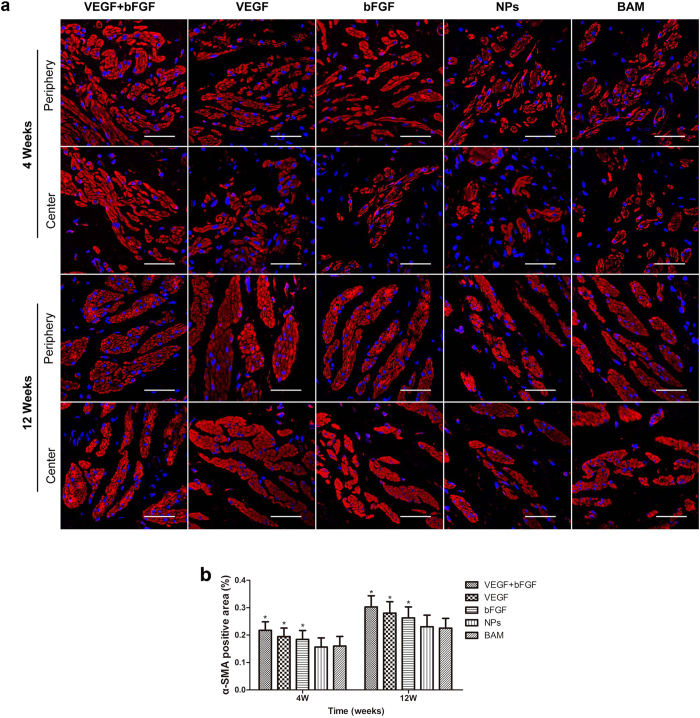
Figure 5. IHC staining for bladder smooth muscle regeneration of the periphery and centre of regenerated bladder tissues in the five groups 4 and 12 weeks post-implantation.
(a) Micrographs of α-SMA protein expression. For all panels, α-SMA expression is displayed in red, (Alexa Fluor 555) and cell nuclei are displayed in blue (DAPI). Scale bars in all panels = 400 μm. (b) Statistical analysis of the percentage of positively stained α-SMA areas. The data are expressed as the mean ± SD, and the error bars represent the SD. *p < 0.05 compared with the BAM group.

