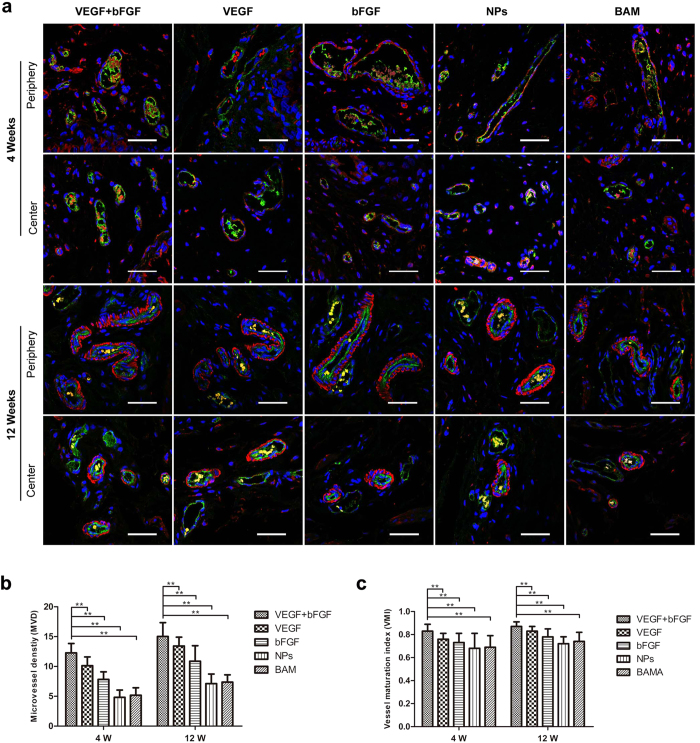
Figure 6. Double-label immunofluorescence combined with CLSM observation of bladder microvascular regeneration of the periphery and centre of regenerated bladder tissues in the five groups at 4 and 12 weeks post-implantation.
(a) CD31 expression is displayed in green (Alexa Fluor 488), α-SMA expression is displayed in red (Alexa Fluor 555), and cell nuclei are displayed in blue (DAPI). Scale bars in all panels = 400 μm. (b) Microvessel density (MVD) and (c) Vessel maturity index (VMI) analyses. **p < 0.01 in comparison to the BAM group.

