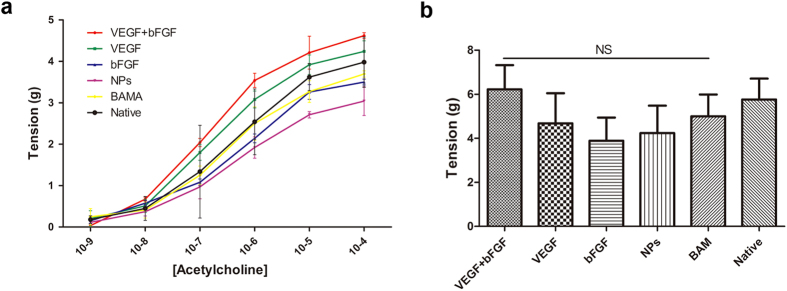
Figure 8. Ex vivo contractility evaluations of central regions of both control and regenerated bladder domes supported by scaffold groups at 12 weeks post-implantation.
(a) Dose response curves for acetylcholine in denuded bladder strips. (b) Contractile responses to increased extracellular KCl (120 mM) in the samples detailed in (a). The data are expressed as the mean ± SD, and the error bars represent the SD. (NS) p > 0.05 compared with the native group.

