
Figure 7. Identification of misregulated autophagy-related genes following APO inhibition.
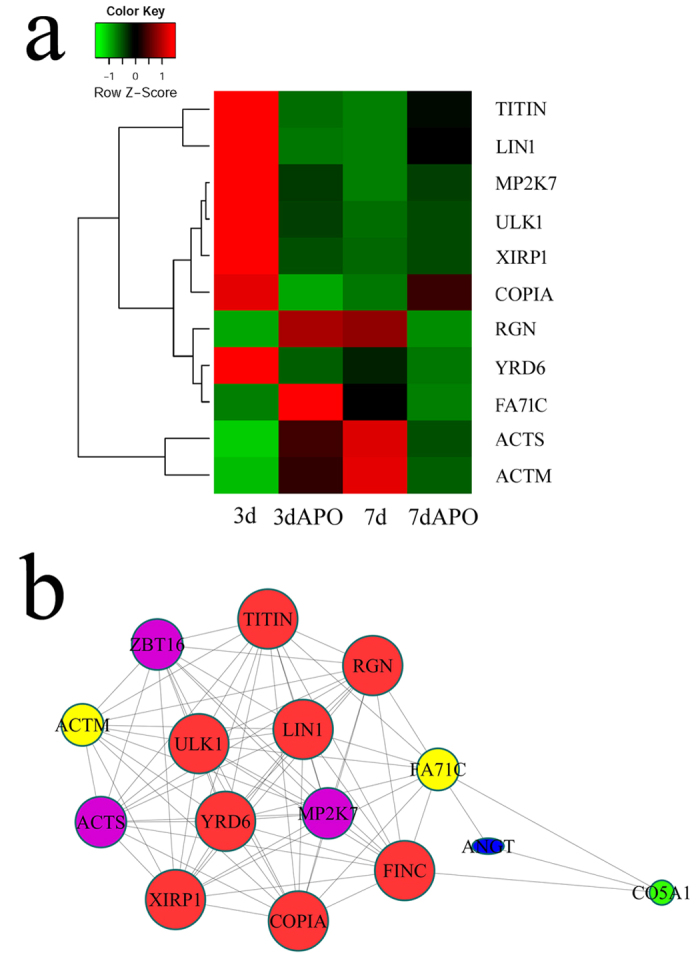
(a) Heatmap and cluster dendrogram of integrated differentially expressed genes at 3d and 7d following APO inhibition; (b) Integrated regulatory network of the differentially expressed genes.