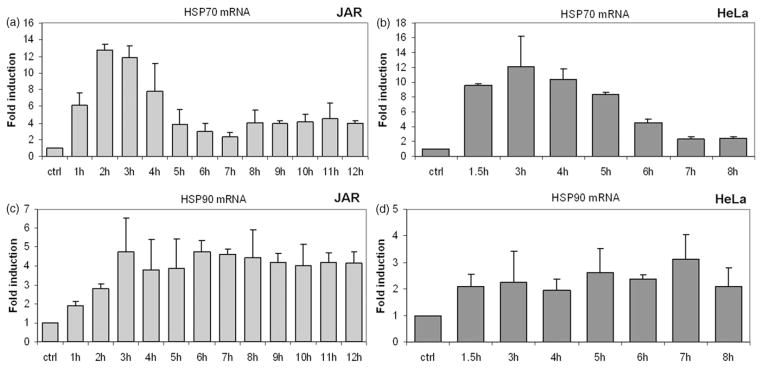
Figure 1.
Transcriptional response of Hsp70 and Hsp90 to fever-range hyperthermia. Mild hyperthermia at 39.5°C induced Hsp70 and Hsp90 mRNA. Bar graphs depict fold changes in mRNA that were measured by RT-qPCR and normalised to GAPDH. Control sample represents cells maintained at 37°C. Human cell lines JAR (placental choriocarcinoma) and HeLa (cervical carcinoma) display typical in vitro response patterns of cells grown at 39.5°C for 8–9 h. Control Hsp70 mRNA expression is up-regulated quickly, peaking at 3–4 h (a, b). Expression levels then fall, stabilising after 7 h at a level above baseline expression. Expression of the Hsp90 gene rises more slowly than Hsp70, reaching a plateau after 5–7 h (c & d). Error bars were calculated using standard deviations based on technical replicates from one of three independent experiments. Statistically significant change in HSP mRNA was seen in both cell lines based on a two tailed Students t-test (p < 0.05).

