
Figure 5.
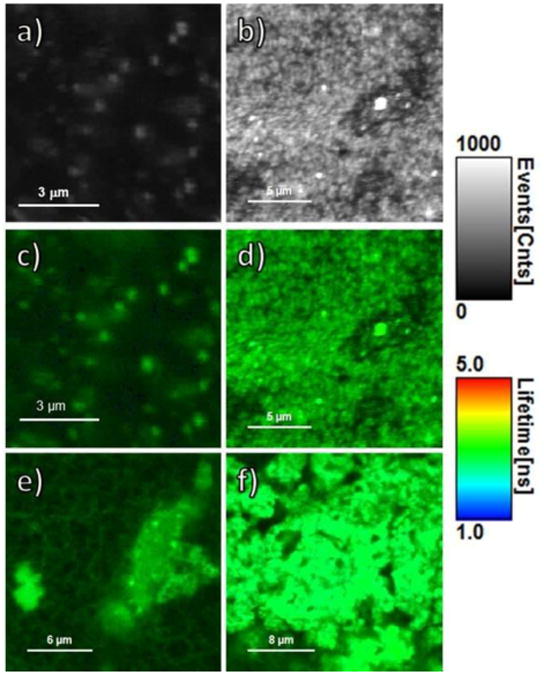
FLIM images of phantoms with RhB base. Depicting only FI (shown in counts of fluorescence events), the images show phantoms containing (a) RhB only and (b) GNS-RhB. Combining FI (shown as brightness) and FLT (shown as color), the images show phantoms containing (c) RhB only, (d) GNS-RhB, (e) GNR690-RhB and (f) GNR760-RhB. For all 6 images, the gray, brightness scale bar represents FI in counts/msec. The color scale bar displays the FLT range in nsec. All images were obtained under the same conditions, same set-up, and same excitation power.