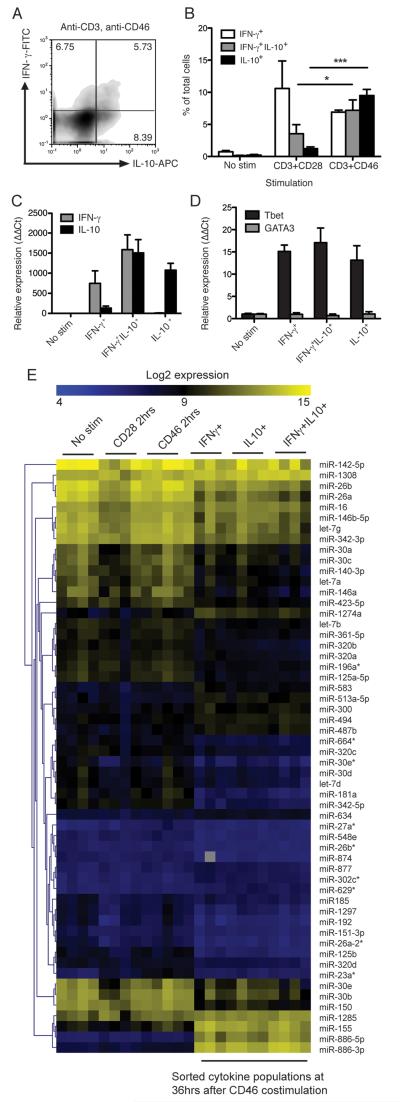
Fig. 1. miRNA microarrays for miRNA profiles in cytokine-secreting Th1 sub-populations.
A) Purified human CD4+ T cells were stimulated for 36 hrs using immobilised plate-bound antibodies as indicated then stained for secreted IFN-γ and IL-10. Numbers denote percent of cells in each quadrant. B) The amounts of cells secreting IL-10 and IFN-γ from three independent experiments is shown, each using cells from an independent donor. C) Cells from 4 healthy donors were stimulated for 36 hrs stimulation, and IFN-γ+, IL-10+, or IL-10+IFN-γ+ cytokine-stained sub-populations were then separated from each by automated cell sorting, and their total RNA purified. To verify the integrity of these cytokine-secreting sub-populations, cytokine transcript levels were assessed by qPCR, results show mean expression data from three of the four donors, n=3. D) qPCR was also used to verify the Th1 identity of the sorted cell populations in three of the four donors, n=3. E) RNA samples from the same cytokine-secreting sub-populations from the 4 biological replicates, as well as RNA from unstimulated cells, and cells stimulated for only 2 hrs with either CD3/CD28 or CD3/CD46, were analysed using hybridisation microarrays with LNA probes covering 840 human miRs. Significant analysis of microarrays (median FDR=0%) identified 56 differentially-regulated miRNAs in different human T cell populations before/after activation. qPCR results show mean ± S.D. of at least 3 biological replicates. *, p < 0.05 **, p < 0.01, ***, p < 0.001 by one-way ANOVA. mRNA expression is relative to unstimulated cells (ΔΔCt method).

