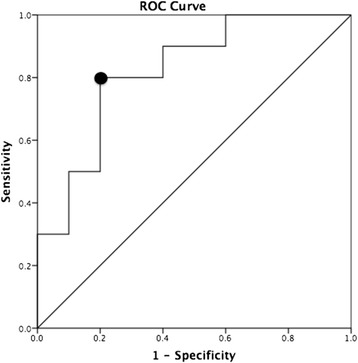
Fig. 1.

Example of an ROC curve based on fictitious data from a leg power field test. The area under the ROC curve (AUC) is 0.82, indicating a moderately accurate discriminative ability of the field test. The optimal cut-off point is marked with a black circle. The sensitivity and specificity corresponding to the optimal cut-off point are respectively 0.80 and 0.80
