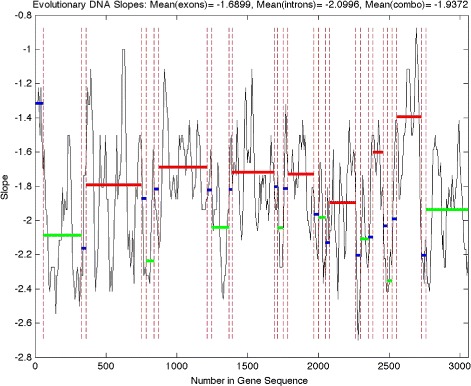
Fig. 6.

Honeybee cumulative evolutionary slope for gene “LOC408625” on the first chromosome. Solid red line: Average slope for a coding sequence (exons), solid green line: Average slope for a noncoding sequence (introns), solid blue line: Average slope for a sequence with a mixture of coding and noncoding, dotted red line: Division between type (exons, introns, combination) of region
