Fig. 8.

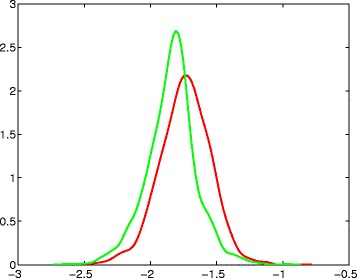
Kernel density estimates. Kernel density estimates for cumulative evolutionary slopes, shown on the horizontal axis, of exons (red) and introns (green)

Kernel density estimates. Kernel density estimates for cumulative evolutionary slopes, shown on the horizontal axis, of exons (red) and introns (green)