Fig. 5.

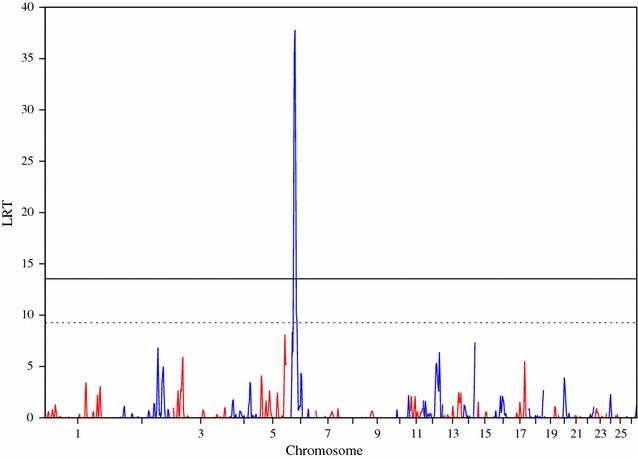
Manhattan plot of the LRT across the genome for fat weight accounting for live weight, using regional heritability mapping. Genome-wide threshold (p < 0.05) is represented as a solid line and suggestive threshold as a dashed line

Manhattan plot of the LRT across the genome for fat weight accounting for live weight, using regional heritability mapping. Genome-wide threshold (p < 0.05) is represented as a solid line and suggestive threshold as a dashed line