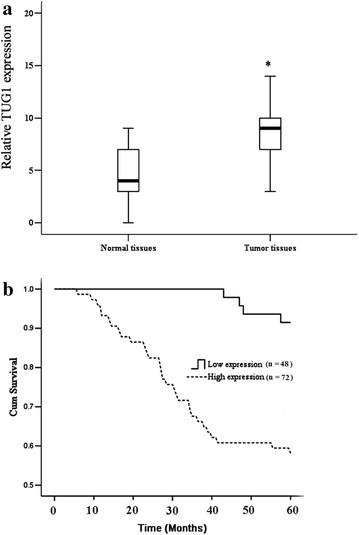
Fig. 1.

TUG1 is upregulated in primary human CRC samples. a Statistical analysis was performed to present TUG1 expression in paired para-tumor/tumor samples in each clinical sample test. b Kaplan–Meier curves of CRC patients with low versus high expression of TUG1 (n = 120, P < 0.001, log-rank test); high expression showed that tumor TUG1 expression is 5 times higher than para-tumor tissue; low expression showed that tumor TUG1 expression is 5 times lower than para-tumor tissue. Values represent mean ± SD. * P < 0.05 compared with normal tissues
