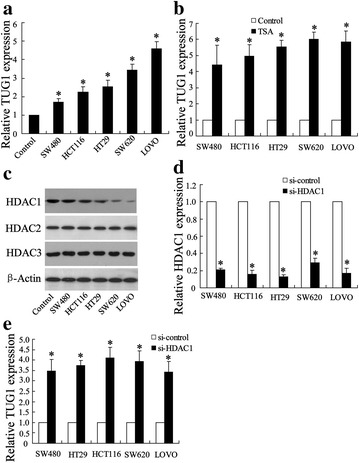
Fig. 2.

Enhanced expression of TUG1 by histone deacetylase inhibition. a Relative ectopic expression of TUG1 in normal colorectal cell (control) and colorectal cancer cell lines by using Q-RT-PCR. b Relative expression of TUG1 in TSA treated normal tissue (control) and colorectal cancer cell lines. c Western blot analysis of HDAC1, HDAC2, and HDAC3 expression in normal colorectal cell (control) and colorectal cancer cell lines; β-actin served as a loading control. d Knock down of HDAC1 by si-HDAC transfection in normal colorectal cells (control) and colorectal cancer cell lines. e Relative expression of TUG1 in si-HDAC treated normal colorectal cells (control) and colorectal cancer cell lines. The colorectal cancer cell lines containing SW480, HCT116, HT29, SW620, and LOVO. Values represent mean ± SD. * P < 0.05 compared with control or si-control
