
Fig. 4.
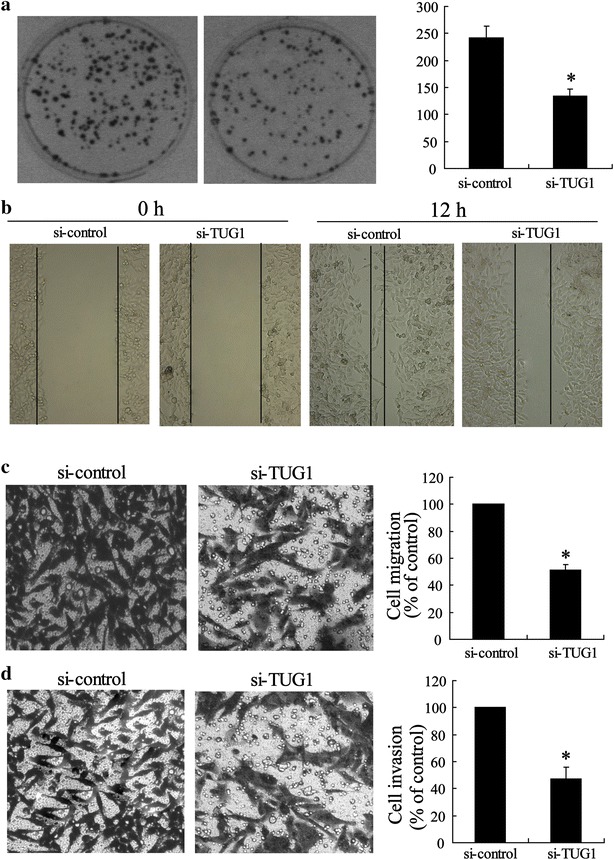
Silenced TUG1 inhibited metastasis of CRC cells. a Representative image and number statistics for colony formation in LOVOsi-control and LOVOsi-TUG1 cells. b Wound-healing assay for motility of LOVOsi-control and LOVOsi-TUG1 cells. Representative pictures of one field at the beginning (t = 0) (left panel) and at the end (t = 12 h) (right panel) of the recording in each condition are shown. c Representative images of transwell migrated cells, and d invaded cells in stably transfected LOVOsi-control and LOVOsi-TUG1 cells and the average number of migrated cells and invaded cells are shown in the right of (c) and (d). Values represent mean ± SD. * P < 0.05 compared with si-control