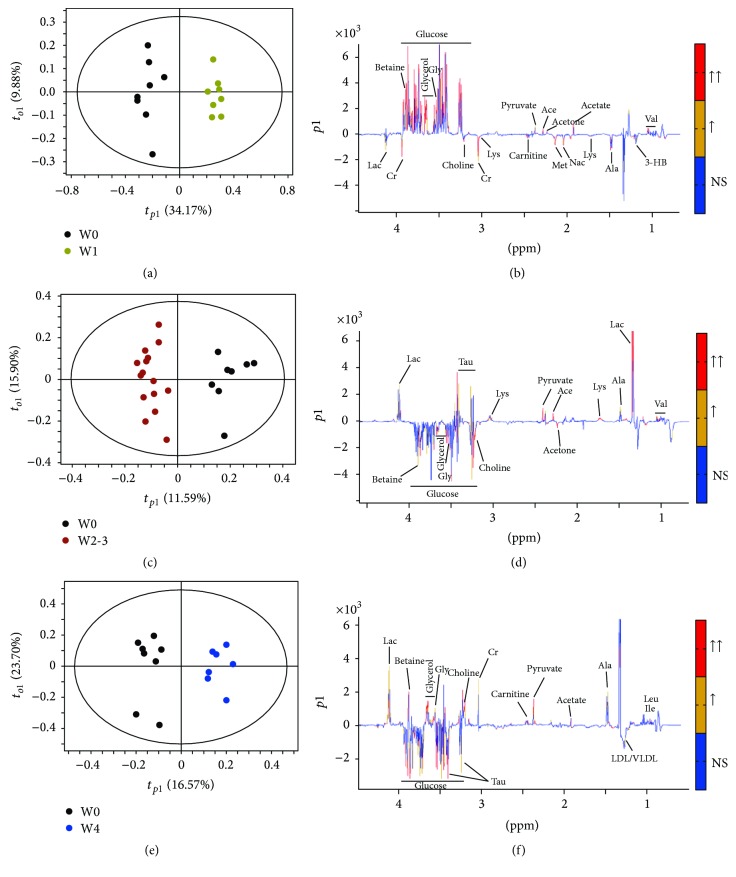
Figure 3.
OPLS-DA score plots ((a), (c), and (e)) and OPLS-DA coefficients-coded loading plots ((b), (d), and (f)). Colors on the loading plots are used to identify the altered metabolites between two groups. When the |r| is greater than the critical value of P = 0.01 and the VIP > 1, the peaks were marked with red color; when the |r| is between the critical values of P = 0.01 and P = 0.05, and the VIP > 1, the peaks were marked with orange color; when the |r| is less than the critical value of P = 0.05 or VIP < 1, the peaks were marked with blue one. (a) and (b) W1 versus W0; (c) and (d) W2-3 versus W0; and (e) and (f) W4 versus W0.

