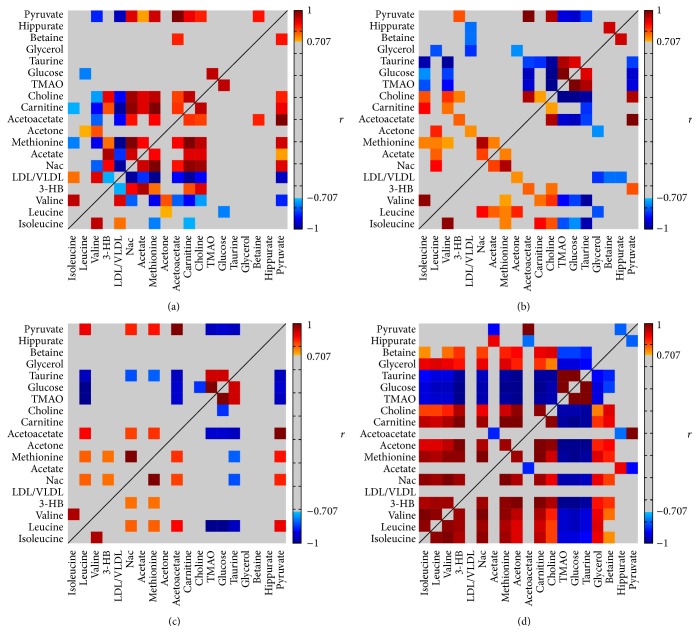
Figure 4.
A color heat map of the Pearson's correlation coefficients computed for the characteristic metabolites observed during the PAH progress. The correlation coefficients between the metabolites at each stage: W0 (a), W1 (b), W2-3 (c), and W4 (d). Correlation coefficients were shown with continuous gradient colors, where significant positive correlation is marked in red, negative is in blue, and grey represents no significant correlation being found. Color bars represent the significance of the correlation coefficients.

