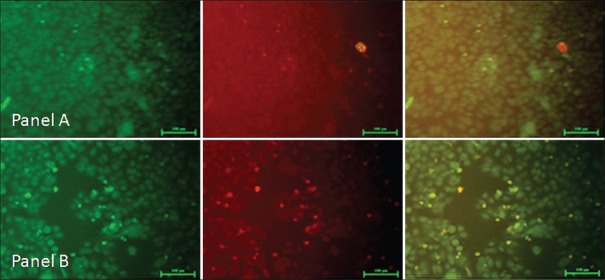
Figure 7.
JC1 stained fluorescence image of KB cells after 24 h treatment of (Cissus quadrangularis 200 μg/ml). Panel (a) Represents control and panel (b) Represents the IC50 dose of Cissus quadrangularis ethanolic extract. The green fluorescence indicates a decrease in mitochondrial membrane potential, an early event in apoptosis as observed in b treated with 200 μg/ml of Cissus quadrangularis extract as compared to panel (a) Control KB cancer cell

