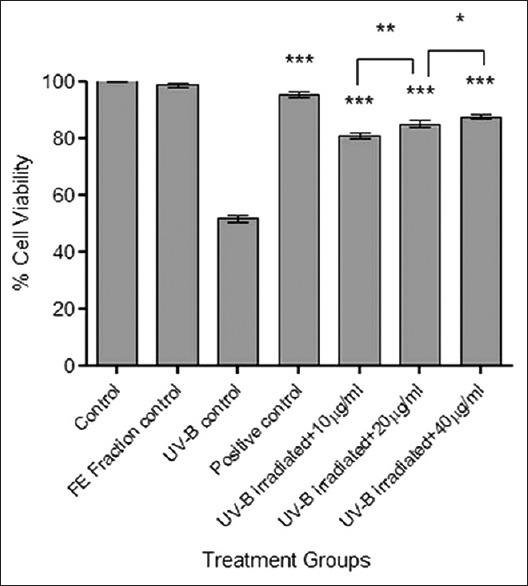
Figure 2.

Cytoprotection studies of flavonoid-enriched fraction by MTT assay. Results were statistically analyzed using GraphPad Prism software by one-way analysis of variance followed by Dunnett's posttest and unpaired t-test to compare in-between the groups, *P < 0.05, **P < 0.01, and ***P < 0.001
