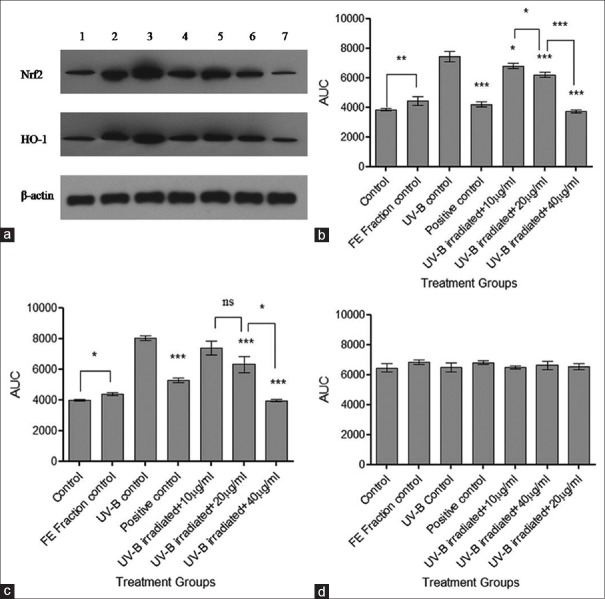
Figure 8.
Western blot analysis for nuclear factor E2-related factor 2 and heme oxygenase-1. (a) Nuclear factor E2-related factor 2, heme oxygenase-1 and β-actin expression where 1 - control, 2 - flavonoid-enriched fraction control, 3 - ultraviolet-B control, 4 - positive control, 5 - ultraviolet-B irradiated fibroblasts + 10 μg/ml fraction, 6 - ultraviolet-B irradiated fibroblasts + 20 μg/ml fraction, and 7 - ultraviolet-B irradiated fibroblasts + 40 μg/ml fraction; (b) Densitometric analysis of nuclear factor E2-related factor 2 bands; (c) Densitometric analysis of haem oxygenase-1 bands; and (d) Densitometric analysis of β-actin bands. Results were statistically analyzed using GraphPad Prism software by one-way analysis of variance followed by Dunnett's posttest and unpaired t-test to compare in-between the groups, *P < 0.05, **P < 0.01, ***P < 0.001

