
Figure 7.
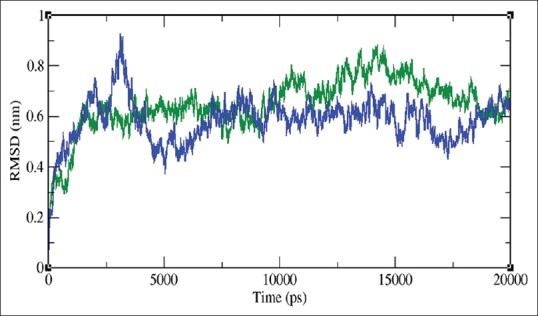
Root mean square deviation of the backbone atoms of docked complexes at 300K, Green color indicates toddanol-reverse transcriptase complex and toddanone-reverse transcriptase complex is shown in violet
Official websites use .gov
A
.gov website belongs to an official
government organization in the United States.
Secure .gov websites use HTTPS
A lock (
) or https:// means you've safely
connected to the .gov website. Share sensitive
information only on official, secure websites.
Root mean square deviation of the backbone atoms of docked complexes at 300K, Green color indicates toddanol-reverse transcriptase complex and toddanone-reverse transcriptase complex is shown in violet