Figure 5.

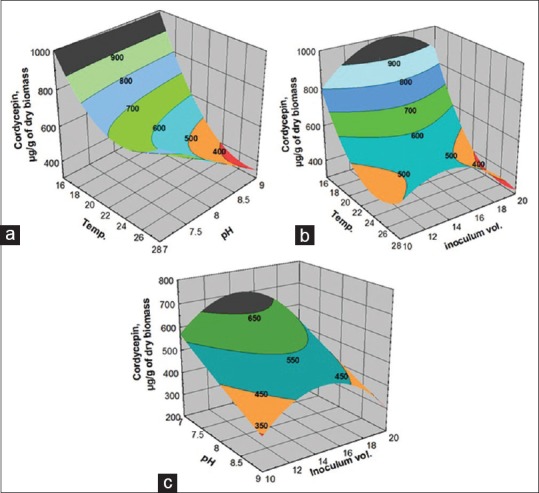
Response surface plots showing the (a) Effect of temperature and pH; (b) effect of temperature and inoculum volume; (c) pH and inoculum volume on cordycepin yield

Response surface plots showing the (a) Effect of temperature and pH; (b) effect of temperature and inoculum volume; (c) pH and inoculum volume on cordycepin yield