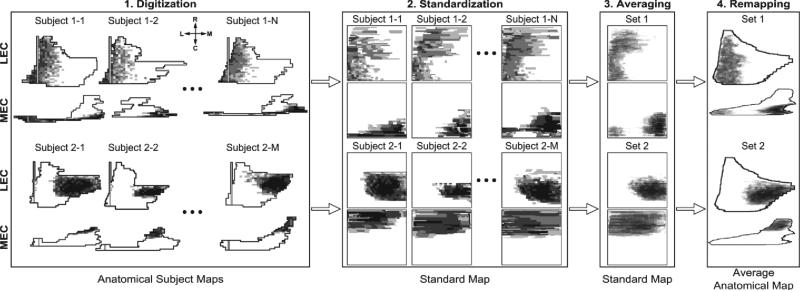
Fig. 3.
Summary of the image processing pipeline used to quantify the EC-DG topography from data obtained from [38]. Not all data is shown. 1) The data in their anatomical subject maps are digitized and grouped according to injection location. 2) The maps are projected onto a standard coordinate space. 3) The sets are averaged. 4) The averaged group data are projected onto an average anatomical map. The compass represents the rostro-caudal and medio-lateral axes.

