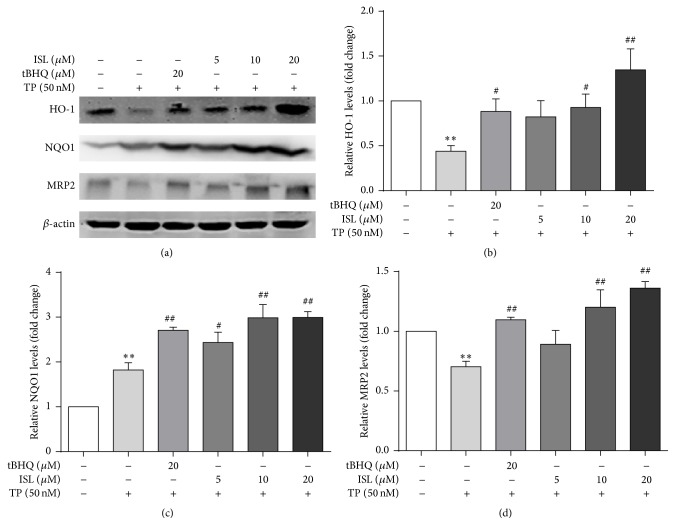
Figure 5.
Cells were treated with different concentrations of ISL and tBHQ for 12 h, after which they were exposed to 50 nM TP for 24 h. The protein expressions (a) and gray value of HO-1 (b), NQO1 (c), and MRP2 (d) were measured (n = 3). ∗∗ p < 0.01 versus control; # p < 0.05 versus TP group, ## p < 0.01 versus TP group. Control (Column 1): 0.1% DMSO.

