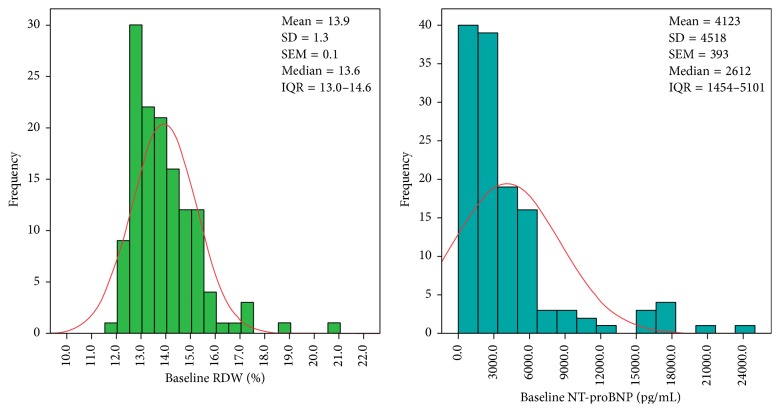
Figure 1.
Histogram of baseline RDW and NT-proBNP. Both the RDW and NT-proBNP differ from the red line of normal distribution. RDW = red blood cell distribution width; NT-proBNP = N-terminal pro-B-type natriuretic peptide; SD = standard deviation; SEM = standard error of the mean; IQR = interquartile range (25% percentile–75% percentile).

