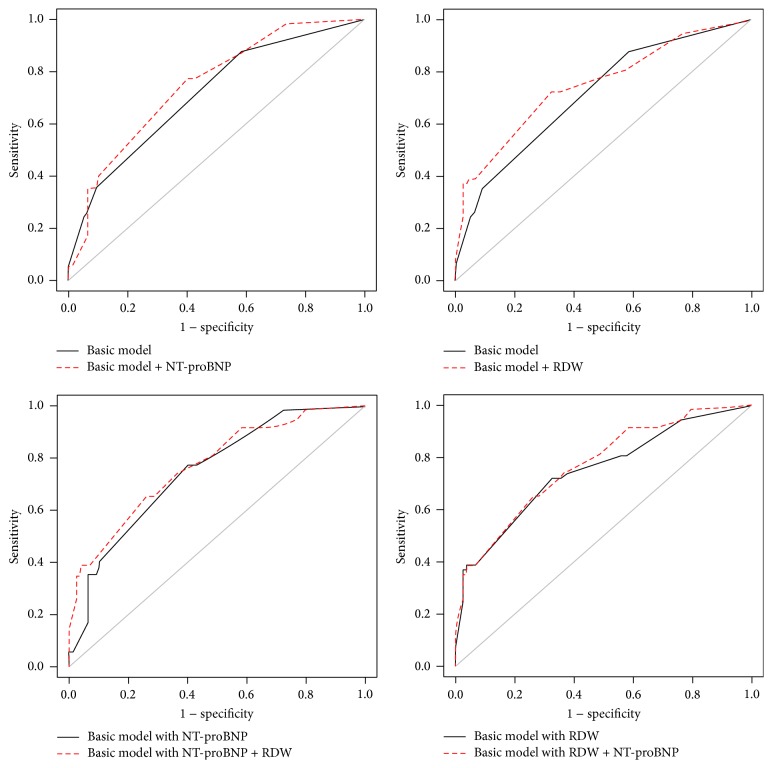
Figure 4.
Increasing predictive capacity of the models. The C-statistics measures the overall AUCs of the prediction models and displays the overall predictive powers of the models in a more conservative fashion than Cox regression. AUC = area under the curve; RDW = red blood cell distribution width; NT-proBNP = N-terminal pro-B-type natriuretic peptide.

