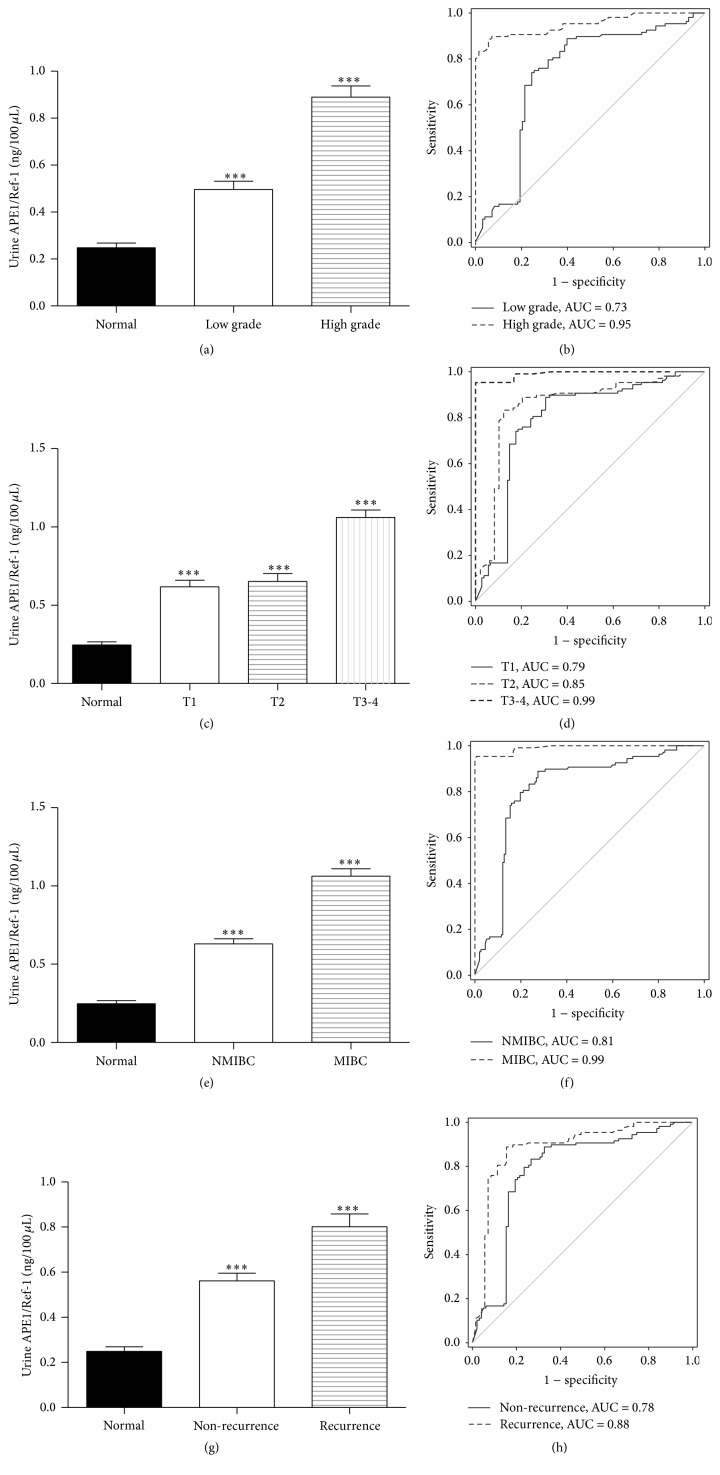
Figure 2.
Urinary APE1/Ref-1 levels are associated with bladder tumor grade, stage, muscle invasion, and recurrence. (a) Each bar shows the mean ± standard error of the mean (SEM) (n = 98 for low-grade tumors, n = 71 for high-grade tumors, and n = 108 for noncancer controls). (b) ROC curves for APE1/Ref-1, the determination of different bladder tumor grades. (c) Urinary APE1/Ref-1 levels are elevated in patients with higher stage tumors. Each bar shows the mean ± SEM (n = 49 for stage T1, n = 10 for stage T2, n = 2 for stage T3-T4, and n = 108 for noncancer controls). (d) ROC curves for APE1/Ref-1, the determination of different bladder tumor stages. (e) Urinary APE1/Ref-1 levels are higher in patients with muscle-invasive bladder cancer. Each bar shows the mean ± SEM (n = 157 for non-muscle-invasive bladder cancer [NMIBC], n = 12 for muscle-invasive bladder cancer [MIBC], and n = 108 for noncancer controls). (f) ROC curves for APE1/Ref-1, the determination of different of NMIBC and MIBC. (g) APE1/Ref-1 levels are higher in patients with previously recurrent tumors (n = 71 for previously recurrent tumors and n = 98 for nonrecurrent tumors). (h) ROC curves for APE1/Ref-1, the determination of recurrent bladder tumors. Bars: SEM. ∗∗∗ p < 0.01, significantly different from noncancer controls.

