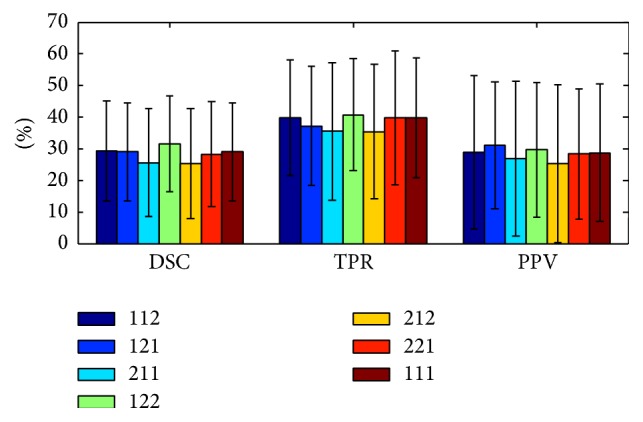
Figure 10.

Segmentation performance with different modality weights (using k = 30 and N = 5). The numbers in the legend from left to right are the modality weights C T1, C T2, and C FLAIR in the metric, respectively. (The results reported in Section 3.2 and Table 1 are with C T1 = C T2 = C FLAIR = 1.)
